This is a site dedicated to power system frequency and timing. The name is a play on words – I gather frequency data from the grid using the wall outlet in my home, and this site is an outlet for the data.
I’ve been meaning to do this for a while, but the July 22, 2026 data center event was the motivation for finally getting it started.
Latest Eastern Interconnection frequency events shown here:
A couple articles appeared that quoted data from my original LinkedIn post on the July 22, 2026 Northern Virginia data center load loss event. A 230kV transmission line operated in “data center alley” and around 3800 MW of data center load disappeared from the grid. This is likely due to the data centers not being able to “ride through” the line disturbance.
The first one is from an Australian site called WattClarity.
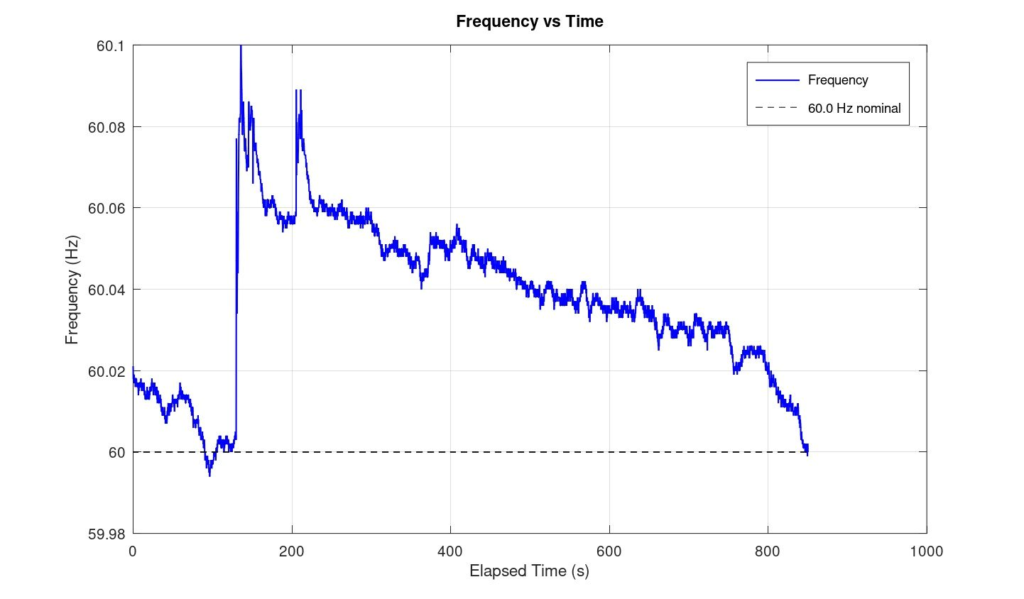
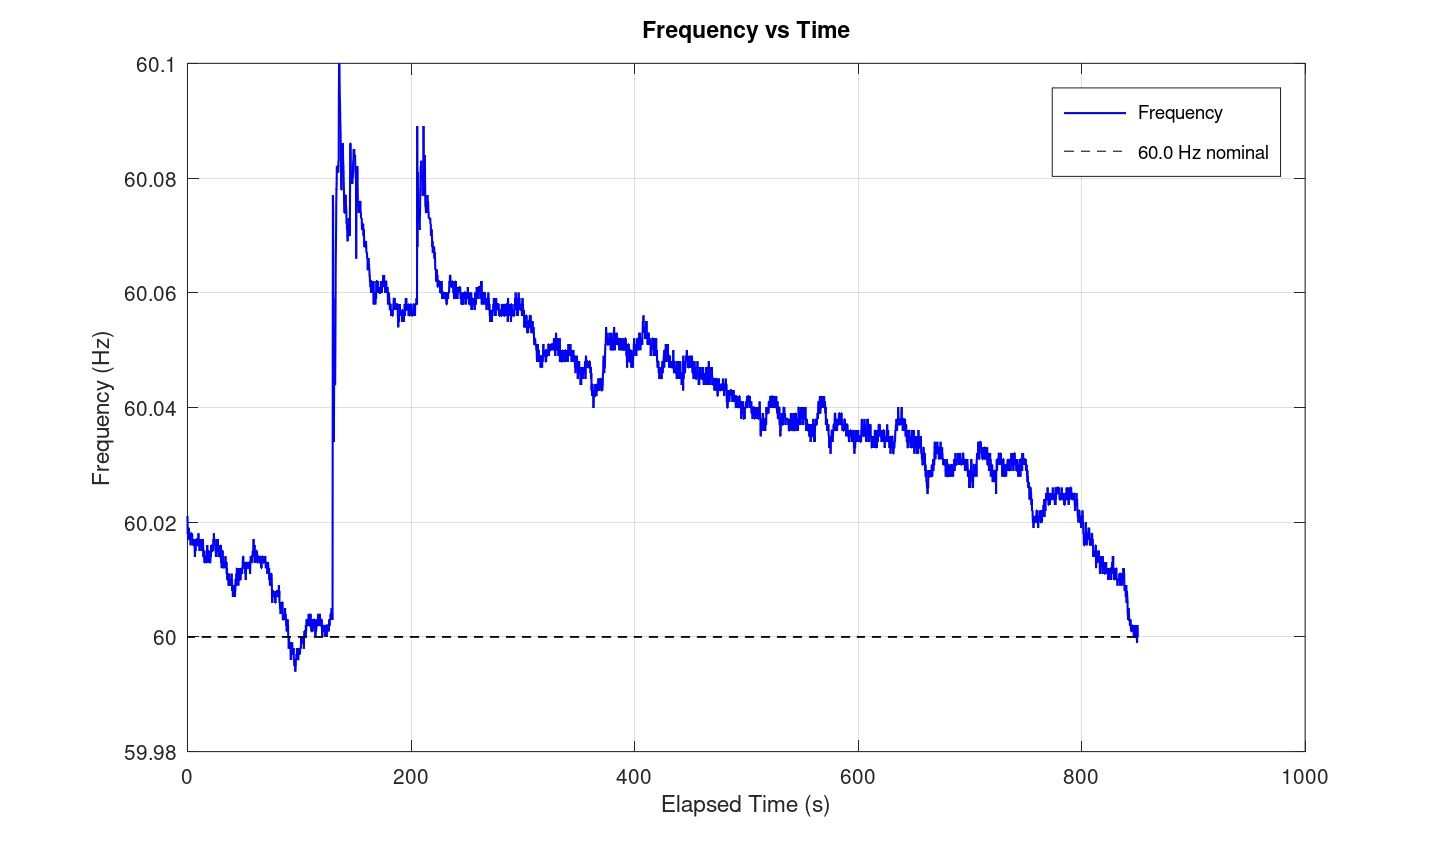
On July 22, 2026, a fault on a 230 kV transmission line triggered the loss of roughly 3,800 MW of load, as data centers switched over to internal backup power. The result was one of the steepest frequency swings I’ve recorded: grid frequency jumped from 60.000 Hz to nearly 60.1 Hz in a matter of seconds. My home-built PSFM-1 recorder caught the whole thing, shown below.
Figure 1 – PSFM-1 recording of the July 22, 2026 frequency event
That chart is what caught people’s attention when I posted it on LinkedIn — a large, fast frequency deviation, over in a couple of minutes, with the questions immediately turning to: how does a piece of home-built equipment sitting in a house catch something like this?
The short answer: PSFM-1 is a small, inexpensive circuit that plugs into a wall outlet and counts the incoming AC power cycles with high precision — precise enough to detect frequency shifts of a few thousandths of a hertz, several times a second. When the grid loses generation or load, its frequency rises or falls, and PSFM-1 picks up that shift in real time and flags it as a trigger event. I built the first version in 2008, upgraded the electronics in 2011, and it’s been recording nearly continuously ever since.
What follows is the full technical writeup — the circuit design, the triggering logic, and some of the debugging stories along the way — for anyone who wants to go deeper.
How PSFM-1 Works
The PSFM-1 recorder uses voltage from a wall outlet to monitor grid frequency. It was originally designed and built in 2008 and got an upgrade with a new controller around 2011. The recorder was inspired by my work with Jim Ingleson, who I met at the Georgia Tech Fault and Disturbance conference in the early 2000s. Jim worked at NYISO and was very interested in all things regarding frequency. We co-authored several papers together, including one on frequency triggering (2006) and one on the cause of frequency disturbances during the Super Bowl (2013). The Super Bowl paper eventually turned into an article in the IEEE PES magazine in October 2016. Jim wanted to be able to monitor frequency at home without spending thousands of dollars on a fancy DFR or relay, and that’s when I started working on this recorder. The Super Bowl paper used frequency data from a PSFM at my house in Richmond, VA and at Jim’s house in New York.
Here’s a technical description of the recorder itself.
Incoming voltage is stepped down to around 6.3 volts with a transformer. This voltage is then fed into a voltage divider that gets it to around 5V. This voltage then is fed to a Schmitt trigger that turns the sine wave into square wave pulses. These pulses then go to a divider circuit that is set to divide by 9. For every 9 cycles there is one pulse that is 9 cycles long. The divider then takes 1 cycle to reset so the whole measurement takes 10 cycles, which works out to 6 samples per second.
The reason for the divider circuit is to reduce jitter in the measurement. If I measure every cycle’s rising and falling edge, then there is a little bit of jitter associated with each edge. By reducing the number of edge measurements I get a much cleaner signal. I had a fortunate opportunity to test this as I was working on the circuit – workers were using an electric jack hammer to break up my back porch (we were having a patio installed) and without the divider the frequency measurement was very jumpy, and adding the divider greatly reduced the noise.
The microcontroller I am using is a Coridium ArmExpress chip (obsolete since about 2014) with a clock at 60 MHz. This allowed me to measure pulse width to the microsecond. With a 9 cycle measurement, that works out to 150,000 microseconds for 9 cycles.
The microcontroller also has a not-too-great 10 bit A/D, so I rectify the incoming voltage and smooth it with a capacitor. That voltage goes into the A/D so I can also read approximate RMS voltage.
The hardware then spits the measurements out of a serial port. That data is captured by a Windows program that converts the measurements to frequency and voltage that records and triggers for the quantities.
Data is recorded continuously and triggers are noted in a separate trigger file.
Trigger Logic
The recorder has several triggers.
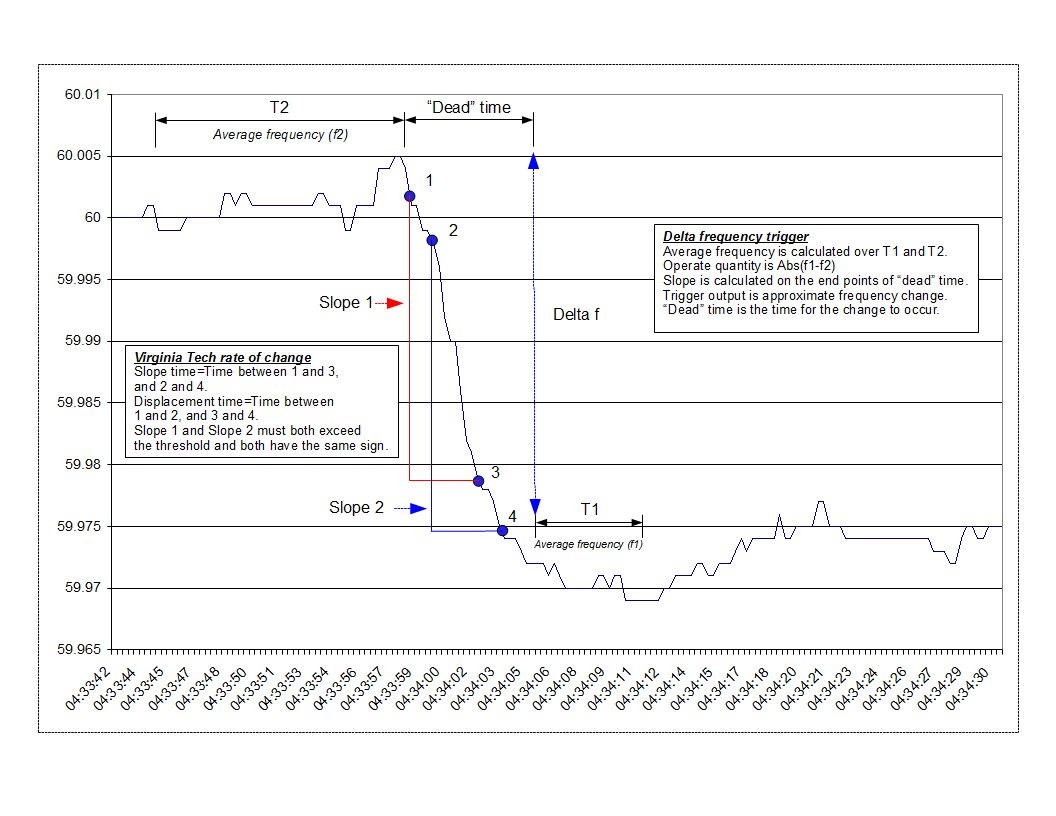
Frequency Delta trigger. This one operates by averaging two time periods. The first (T1) is a longer measurement of about 7 seconds, followed by a five second dead band of no measurement (T3), then a 3.5 second average (T2). The output of the trigger is the difference between the two averages (F2 – F1). This is evaluated for every incoming sample. This results in a sliding window calculation. Since I am most familiar with the Eastern Interconnection, my settings are appropriate for that.
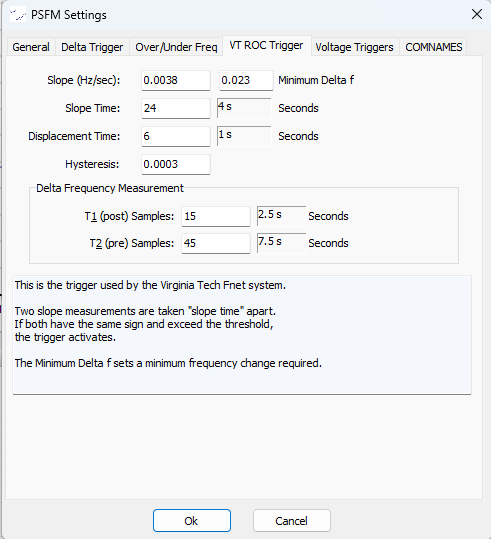
FNET Rate-Of-Change – In my software I call this the VT ROC trigger since FNET was based at Virginia Tech at the time I developed this. FNET is now at the University of Knoxville (UTK) in Tennessee. This trigger looks at two successive slopes. This simply takes two measurements that are four seconds apart and calculates the difference. This measurement is repeated one second later. The two are then compared for magnitude and direction, and if they agree, the trigger asserts. This one also works in a sliding window fashion on every incoming sample.
The trigger operation for both triggers is shown below in Figure 2.
The recording software also has over/under frequency as well as over/under voltage triggers.
Figure 2 – PSFM-1 Trigger Operation
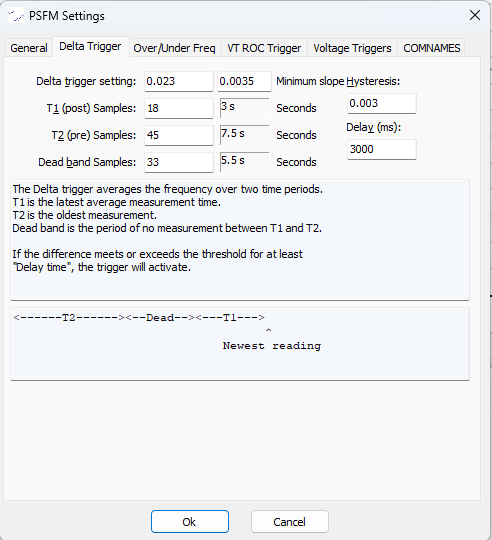
Trigger settings for the Eastern Interconnection are as follows:
Figure 3 – Delta Trigger Settings
Figure 4 – ROCOF Trigger Settings
I discovered that triggering on raw data resulted in false trigger operations, some of which were due to capacitor bank switching at the substation that feeds my house. I worked at Dominion Energy at the time, so I was able to correlate cap bank switching directly with my false triggers. The sudden phase shift caused the frequency measurement to spike suddenly but would quickly return to normal. The solution is to trigger on median data. I added a 10-point median filter which dismissed the outliers and allowed me to capture only real grid load events. The raw data is saved to the continuous files, and median data is only used for triggering.
I now have frequency data recorded almost continuously since 2008.
Coming soon I’ll have a description of the software ecosystem surrounding the device and its data.
Events like July 22 don’t happen often, and most people never see the underlying data. It usually shows up in interconnection-wide reports well after the fact, if at all. PSFM-1 has been recording the grid’s frequency from an ordinary wall outlet for close to two decades, and every so often it catches something like this in real time: a sudden loss of thousands of megawatts of load, and the interconnection’s near-instantaneous response to it. It’s a good reminder of how tightly balanced, and how resilient, the grid actually is.